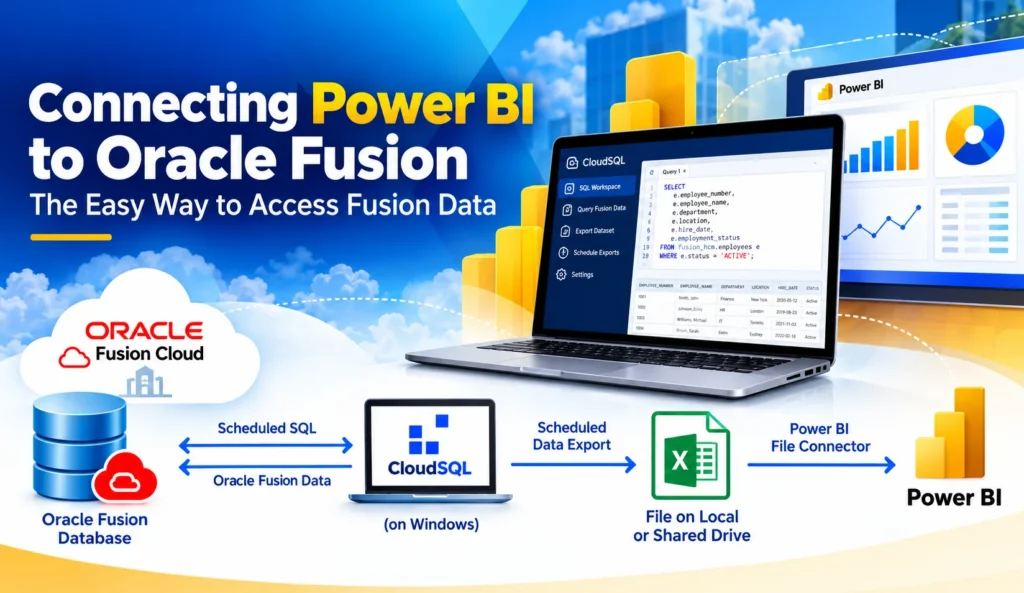
Many organizations that implement Oracle Fusion Cloud ERP rely on Power BI to create transactional intelligence, interactive reports, and visually compelling dashboards.
However, one of the biggest challenges faced by Power BI developers is connecting Power BI to Oracle Fusion and accessing real-time Fusion data for reporting.
Unlike traditional on-premises ERP systems, Oracle Fusion does not provide direct database access to its underlying transactional database. As a result, organizations often struggle to find an effective Oracle Fusion connector for Power BI that can deliver timely and reliable data.
To overcome this limitation, many companies extract data from Oracle Fusion and load it into a separate database before connecting Power BI.
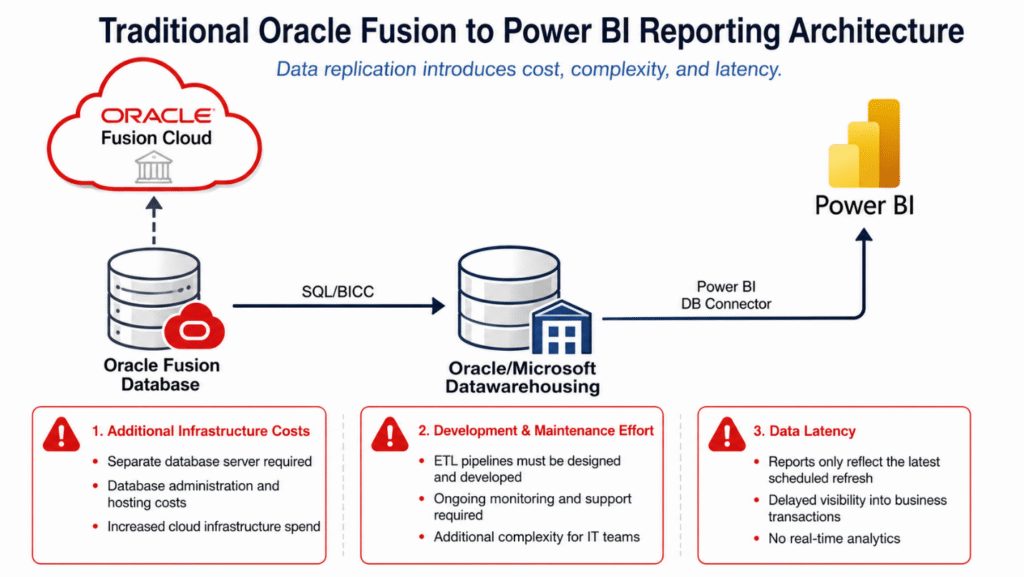
While this approach enables reporting, it introduces several challenges:
- Additional infrastructure costs: A separate database server must be provisioned and maintained.
- Development and maintenance effort: Data pipelines must be designed, developed, monitored, and supported.
- Data latency: Reports and dashboards are only as current as the latest data refresh, preventing true real-time analytics.
These challenges increase both the cost and complexity of Power BI reporting for Oracle Fusion users, creating a need for a simpler and more efficient Oracle Fusion-Power BI integration solution.
Is There a Simpler Way to Connect Power BI to Oracle Fusion?
Fortunately, there is a simpler and more cost-effective approach to connecting Power BI to Oracle Fusion without the need for a separate data warehouse.
Many organizations assume that Power BI requires a direct database connection to Oracle Fusion in order to deliver up-to-date reports and dashboards. As a result, they invest in complex data replication architectures that increase cost, maintenance effort, and reporting latency.
In reality, Power BI can work very effectively with file-based datasets when the refresh process is designed correctly. When connecting to Excel or CSV files, Power BI uses Import mode, meaning the contents of the file are imported into the Power BI semantic model rather than queried directly.
As long as the source files are updated regularly and the dataset is refreshed, reports and dashboards can display the latest available Oracle Fusion data.
This opens up an alternative integration approach for Oracle Fusion customers. Instead of extracting data into a separate reporting database, Oracle Fusion reports can generate data files that Power BI consumes directly.
The result is a simpler architecture that eliminates the need for additional database infrastructure, reduces development effort, and provides near real-time access to Oracle Fusion data.
For organizations looking for an Oracle Fusion connector for Power BI, this approach offers a practical way to build powerful dashboards while avoiding the complexity and cost of traditional data warehousing solutions.
A typical workflow looks like this:
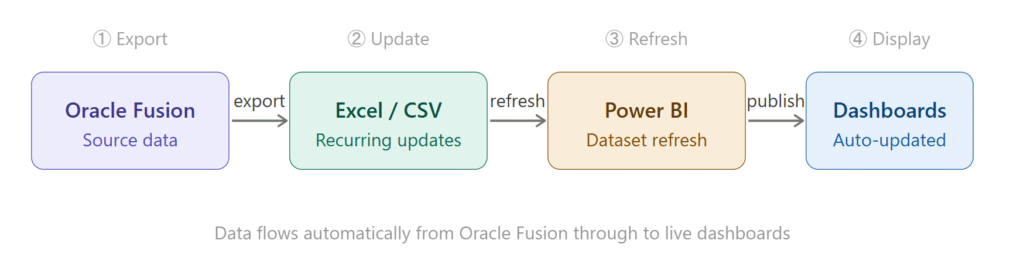
- Oracle Fusion data is exported into an Excel or CSV file.
- The file is updated on a recurring schedule.
- Power BI imports the latest version of the exported file into its semantic model. Depending on where the file is stored, Power BI updates the semantic model using the appropriate refresh mechanism.
- Dashboards display the latest information automatically.
For many reporting scenarios, this approach is more than sufficient. HR dashboards, operational reports, executive scorecards, procurement analytics, and project reporting often require data that is refreshed daily rather than every few minutes.
| Note: Because Excel and CSV connections use Import mode, Power BI stores a copy of the data inside its semantic model. Any changes made to the source file become visible only after the Power BI semantic model is updated. |
So, what is the challenge?
The challenge is rarely Power BI itself. The challenge is generating those Excel or CSV files consistently without relying on manual exports.
This becomes particularly important for Oracle Fusion customers, where direct database access is not available and reporting teams need a reliable way to extract and deliver data for downstream analytics tools.
How CloudSQL Simplifies Oracle Fusion Reporting?
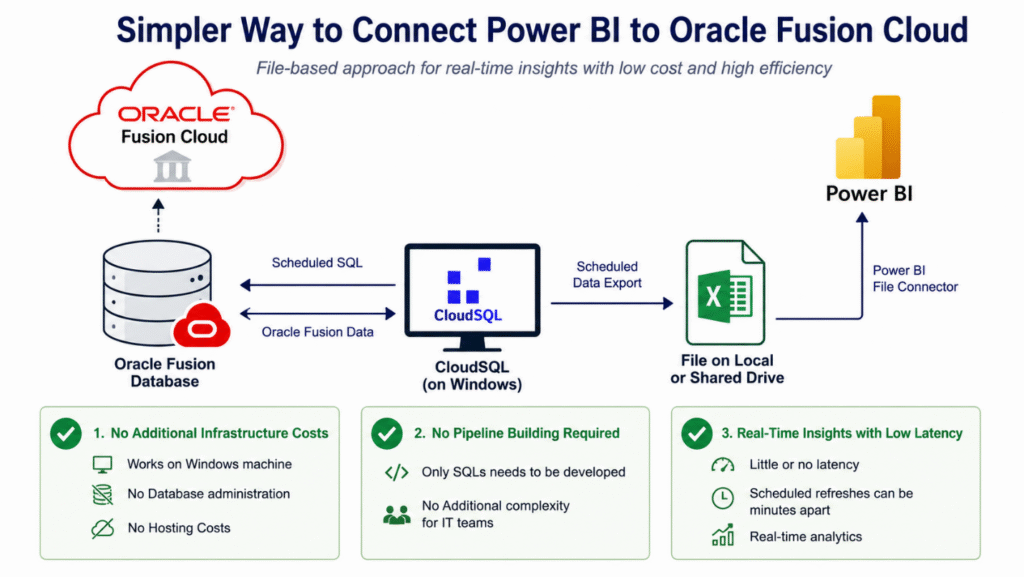
The challenge with Oracle Fusion reporting isn’t building dashboards. It’s creating a reliable process that gets fresh Oracle Fusion data into those dashboards consistently. CloudSQL addresses this by providing a dedicated reporting workspace between Oracle Fusion and Power BI.
Instead of building custom integrations or manually exporting reports every week, reporting teams can work through a simple workflow:
Steps to Create a Power BI Dashboard with Oracle Fusion Data with CloudSQL scheduler
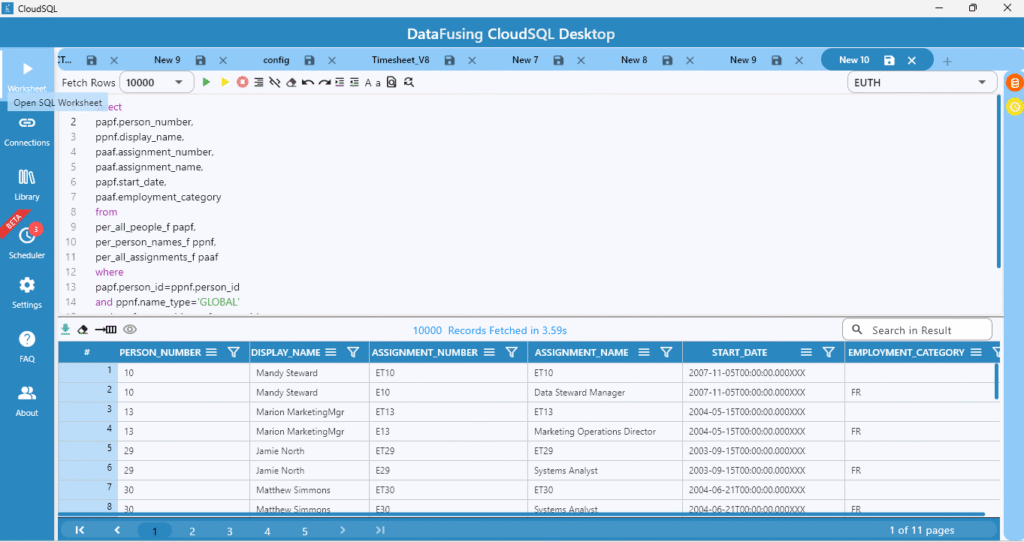
Step 1: Query Oracle Fusion Data
CloudSQL retrieves Oracle Fusion data through REST APIs and presents it in a SQL-based workspace.
This allows technical consultants and analysts to create reporting datasets, validate results, and refine queries before the data reaches Power BI.
Rather than working directly with APIs or managing extraction scripts, reporting teams can focus on preparing the datasets required by the business.
Step 2: Export The Dataset
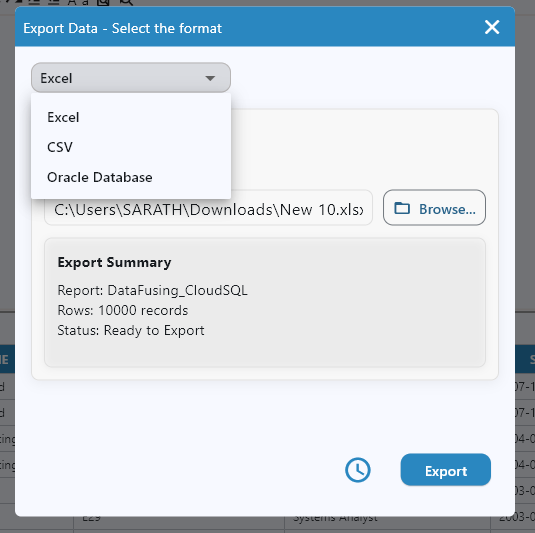
Once the results are validated, the dataset can be exported in a reporting-friendly format.
CloudSQL currently supports:
- CSV exports
- Excel exports
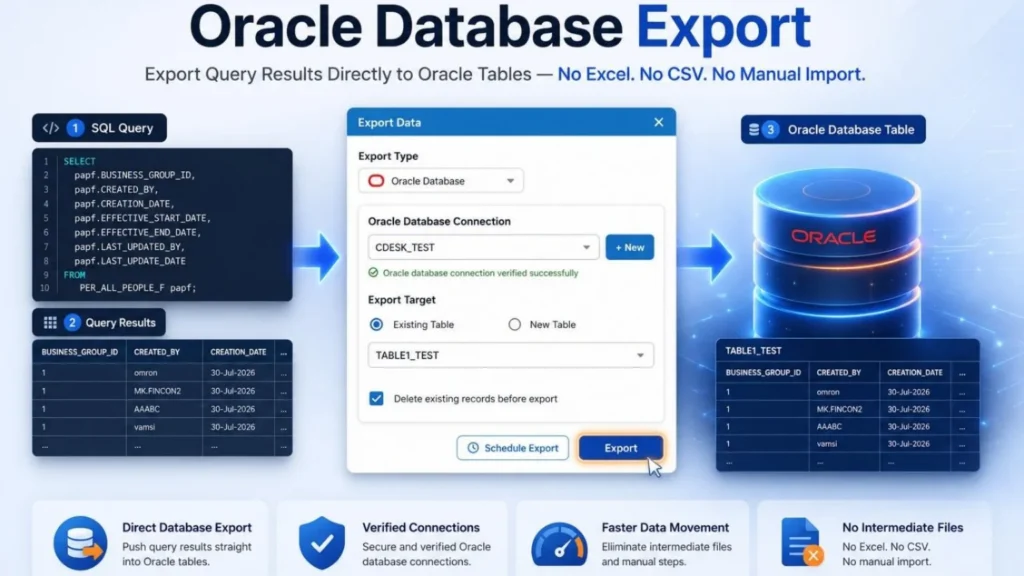
This makes the output immediately usable by reporting tools such as Power BI.
The exported files become the reporting layer that Power BI consumes and refreshes.
Step 3: Schedule Recurring Exports
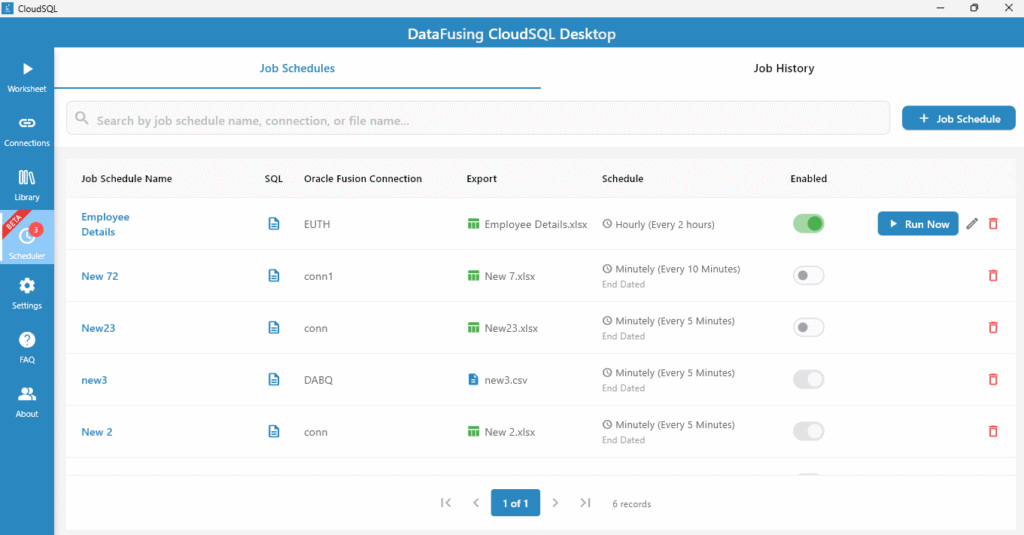
The real value comes from automation.
Instead of manually generating reports every day or every week, CloudSQL allows exports to be scheduled on a recurring basis.
A reporting team can configure a schedule once and allow the export process to run automatically in the background.
This transforms reporting from a manual activity into an operational workflow.
Step 4: Connect the CloudSQL Export to Power BI
Once CloudSQL begins generating scheduled CSV or Excel exports, the remaining configuration is performed in Power BI.
- Open Power BI Desktop and select Get Data → Text/CSV (or Excel Workbook) to connect to the CloudSQL export.
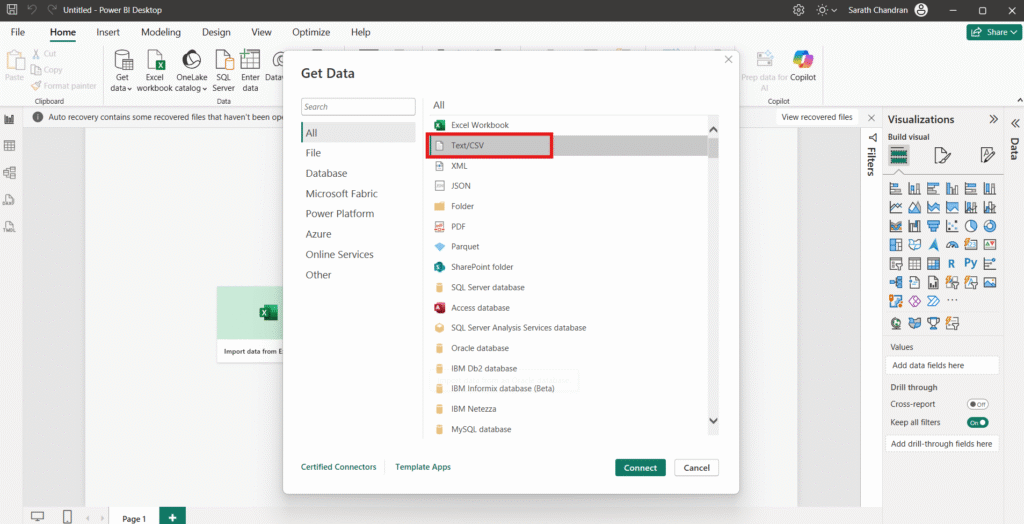
- Build the required report and publish it to Power BI Service.
Note: The exported file is to be stored in OneDrive or SharePoint for Power BI to automatically synchronizes changes from the source file to the semantic model.
- The dashboard then displays the latest available Oracle Fusion data without requiring manual file imports.
| Note: Power BI uses Import mode for Excel and CSV files. Microsoft documents that CSV files stored in OneDrive or SharePoint are synchronized automatically rather than using a separate scheduled refresh configuration for the CSV semantic model. For more information, see: https://learn.microsoft.com/en-us/power-bi/connect-data/refresh-csv-file-onedrive |
Use Case : Building an Employee Dashboard in Power BI
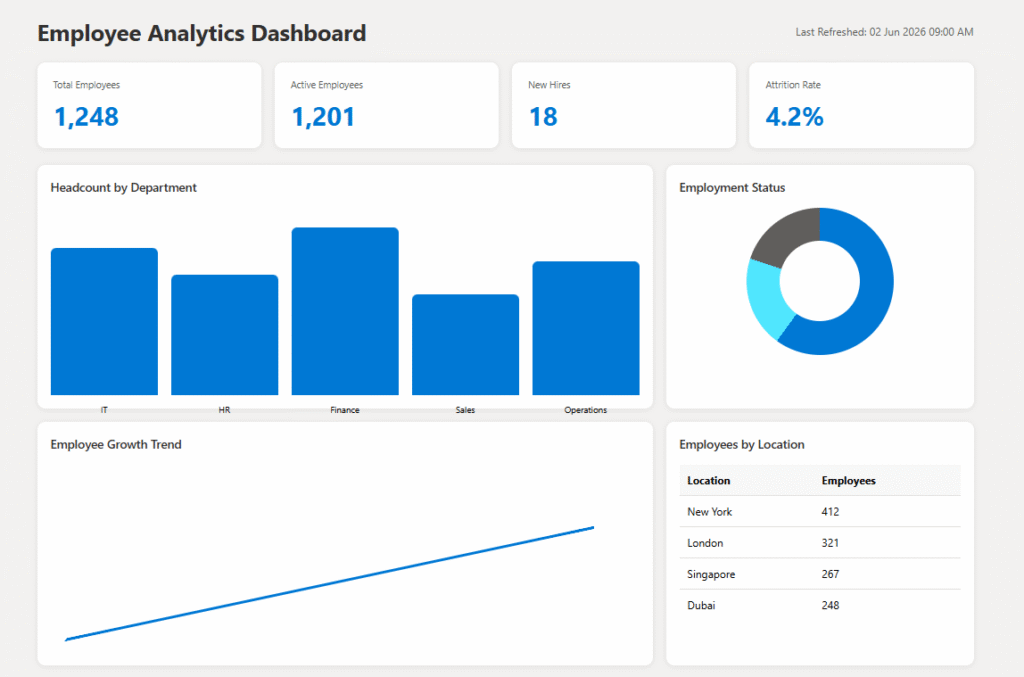
To make the concept more concrete, let’s consider a common reporting requirement: employee analytics. Most organizations already have the data they need inside Oracle Fusion HCM. The challenge is making that information available in a format that business users can consume easily.
Using a scheduled dataset exported from CloudSQL, a Power BI dashboard can provide a consolidated view of workforce information without requiring manual report generation.
A typical employee dataset might include:
| Field | Description |
|---|---|
| Employee Number | Unique employee identifier |
| Employee Name | Employee name |
| Department | Department assignment |
| Business Unit | Business unit |
| Location | Work location |
| Manager | Reporting manager |
| Hire Date | Employee hire date |
| Employment Status | Active, Terminated, Leave, etc. |
Once the dataset is available in Power BI, a variety of visualizations can be built on top of it.
Workforce KPIs
Business users can immediately answer questions such as:
- How many active employees do we currently have?
- Which departments have the highest headcount?
- How is our workforce distributed across locations?
- How many employees were hired this month?
- What is the current employment status breakdown?
Example Dashboard Components
A simple employee dashboard could include:
- Total Employees KPI
- Active Employees KPI
- Headcount by Department
- Employees by Location
- Monthly Hiring Trend
- Employment Status Distribution
- Employee Directory Table
Because the underlying semantic model is updated automatically, business users always work with the latest available information without requiring someone to manually generate reports.
The same pattern can be applied beyond HCM.
Finance teams can build budget and expenditure dashboards.
Procurement teams can monitor supplier and purchasing activity.
Project teams can track utilization and project status.
The underlying principle remains the same: automate data delivery first, then focus on building valuable business insights.
| Want to Build Similar Dashboards?Whether you’re tracking employee analytics, procurement activity, finance metrics, or project performance, the same workflow can be applied across Oracle Fusion modules.If you’re evaluating Power BI for Oracle Fusion reporting and would like to automate data delivery using scheduled CSV or Excel exports, our team can help.👉 Contact Us to discuss your Oracle Fusion reporting requirements. |
Power BI Refresh Considerations
When deploying Power BI reports using CloudSQL-generated CSV or Excel files, it’s worth understanding how Power BI manages data updates.
- Power BI uses Import mode for Excel and CSV files.
- The available refresh capabilities depend on the storage location (such as OneDrive, SharePoint, or a local/network location) and the Power BI license being used.
- At the time of writing, Power BI Pro supports up to 8 scheduled refreshes per day, while higher Power BI capacities support more frequent refreshes.
- Refer to the official Microsoft documentation for the latest refresh capabilities and licensing information.
Is This The Right Approach For Every Organization?
Like most reporting architectures, there is no single solution that fits every Oracle Fusion implementation. The right approach depends on reporting requirements, refresh expectations, budget, and technical complexity.
Organizations building enterprise-wide analytics platforms with thousands of users, multiple source systems, and near real-time reporting requirements may benefit from dedicated connector platforms or data warehouse architectures.
On the other hand, many reporting requirements are significantly simpler.
- An HR team that needs workforce dashboards refreshed every morning does not necessarily require a data warehouse.
- A finance team producing weekly management reports may not need a complex integration platform.
- A procurement team tracking supplier activity often cares more about reliability and simplicity than real-time data delivery.
For these scenarios, scheduled file-based reporting workflows can provide a practical balance between automation and operational effort.
The goal is not to build the most sophisticated reporting architecture. The goal is to provide accurate business insights with the least amount of complexity required to achieve the outcome. That is why many organizations start with scheduled reporting workflows and only move to larger analytics platforms when reporting requirements justify the additional investment.
| Your Requirement | Recommended Approach |
|---|---|
| Weekly HR Dashboard | CloudSQL + Power BI |
| Daily Finance Reports | CloudSQL + Power BI |
| Executive KPI Reporting | CloudSQL + Power BI |
| Cross Application Analytics | Data Warehouse |
| Enterprise Analytics Platform | Connector / Warehouse |
Why Teams Adopt This Approach?
Most reporting challenges are not caused by Power BI.
They are caused by the processes surrounding data preparation and delivery.
Many Oracle Fusion reporting teams start with a simple requirement, build a dashboard but eventually discover that maintaining the data behind the dashboard requires significantly more effort than creating the visualizations themselves.
As reporting requirements grow, manual processes become increasingly difficult to sustain. Teams often find themselves:
- Exporting the same reports repeatedly.
- Managing multiple versions of spreadsheets.
- Troubleshooting inconsistent data extracts.
- Spending more time preparing reports than analyzing them.
A scheduled reporting workflow addresses these challenges by standardizing how data is delivered to reporting platforms.
The benefits are often operational rather than technical.
- Reduced Manual Effort: Once a reporting dataset has been defined and scheduled, there is no need to repeatedly generate and distribute files manually.
- Consistent Reporting Data: Power BI dashboards consume the refreshed semantic model created from the exported Excel or CSV file, ensuring a consistent dataset is used across every report.
- Faster Dashboard Delivery: Reporting teams can focus on building business insights rather than maintaining extraction processes.
- Better Adoption: Business users are more likely to trust and use dashboards when data arrives consistently and predictably.
- Scalable Reporting: The same approach can be applied across multiple Oracle Fusion modules including HCM, Finance, Procurement, SCM, and Projects without creating separate reporting processes for each use case.
Ultimately, the objective is not simply to automate exports.
The objective is to create a reporting process that is reliable enough to become part of normal business operations.
| Traditional Reporting | Automated Reporting |
|---|---|
| Manual exports | Scheduled exports |
| Spreadsheet distribution | Centralized dashboards |
| Stale data | Consistent refreshes |
| Human dependency | Repeatable process |
| Reactive reporting | Proactive insights |